Mobility behaviour - "Mobility in cities" study
Survey on mobility behaviour completed - results available
Since 1972, the city of Chemnitz has regularly taken part in the "Mobility in Cities - System of Representative Transport Surveys" (SrV) survey, which takes place every five years. With the results of the 2018 survey now available, this study is being updated. The key results of the SrV 2018 for the city of Chemnitz are summarised below. The complete study can be viewed in the Transport Planning Department of the City of Chemnitz Transport and Civil Engineering Office.
The aim of the scientific study is to determine mobility-relevant indicators of the city's population in order to analyse mobility behaviour. It is designed as a household survey. All persons living in a household are surveyed. A person's transport behaviour is recorded in the survey for a precisely specified reference date. In principle, all daily journeys of all persons living in a household are surveyed. The reference group is made up of all residents of a city. Commuters are not included. In contrast to the second major survey in Germany, "Mobility in Germany" (carried out on behalf of the Federal Ministry of Transport), the survey period is limited to the average working days of Tuesday, Wednesday and Thursday, excluding holidays and public holidays.
To ensure statistically reliable results, a total of 2000 citizens of the city of Chemnitz were surveyed in SrV2018.
Results SrV2018
The results presented below provide a basic overview of the most important mobility parameters. Further, detailed results on the mobility behaviour of Chemnitz citizens can be obtained from the TBA, Transport Planning Department.
Specific traffic volume | 3,60 | 3,40 | Journeys/person and day |
Daily time in traffic | 70,5 | 72,3 | min |
Average journey time | 19,9 | 21,1 | min |
Average journey distance | 7,1 | 6,8 | km |
Car ownership (private cars) | 552 | 528 | private cars/1000 p.e. |
Bicycle ownership | 750 | 727 | Bicycle/1000 p.e. |
Car occupancy rate | 1,3 | 1,3 | Persons/car journey |
Development of transport mode shares (modal split, all daily journeys)
The so-called modal split is a key parameter for describing transport behaviour in a city. It shows the share of transport modes in all daily journeys. The main mode of transport for a journey is always shown.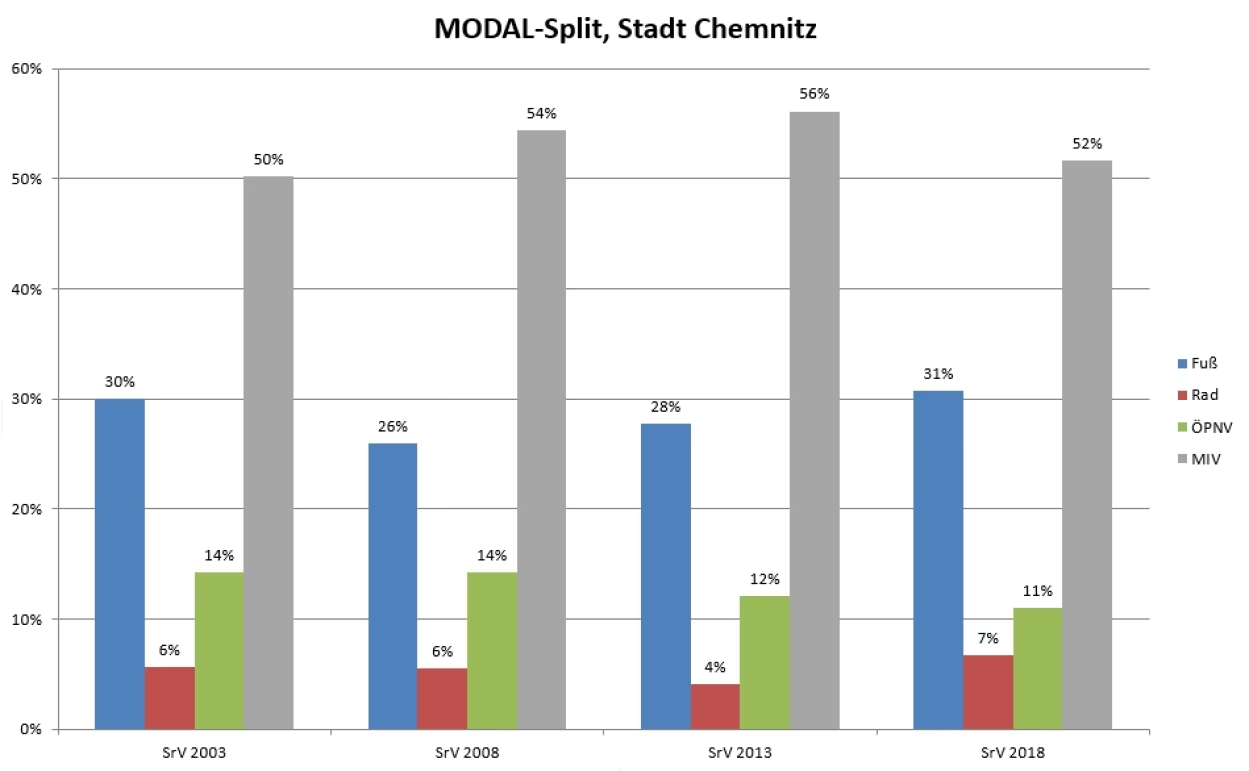
average journey time | average distance | average speed | ||||
(min/distance) | (km/distance) | (km/h) | ||||
2013 | 2018 | 2013 | 2018 | 2013 | 2018 | |
On foot | 14,9 | 16,4 | 1,0 | 1,1 | 4,2 | 4,1 |
Bicycle | 20,8 | 19,4 | 4,4 | 3,9 | 12,8 | 12,0 |
MIV | 19,3 | 20,8 | 9,9 | 10,4 | 31,0 | 30,0 |
PUBLIC TRANSPORT | 34,2 | 38,1 | 7,9 | 7,9 | 13,9 | 12,5 |
Total | 19,9 | 21,1 | 7,1 | 6,8 | 21,4 | 19,4 |
CONCLUSION
The results of SrV 2018 show that although the proportion of journeys made by car (MIT) in Chemnitz has fallen from 56% to 52%, it remains at a relatively high level.
The cycling mode share increased from 4% to 7% compared to 2013. In particular, the number of journeys to work/school/training centres increased. Cycling was not as negatively affected by the weather in the 2018 survey year as it was in 2013. However, there is still a need to catch up in terms of increasing the cycling mode share compared to other cities with public transport, which have significantly higher shares of total traffic.
The share of public transport in total traffic has fallen from 12% to 11% and is at a comparatively low, unsatisfactory level. The journey time and average speed of public transport have deteriorated compared to 2013. Public transport journeys perform significantly worse than motorised private transport, especially in the distance classes of 5 to 10 km that are decisive for public transport journeys.